
To run a successful ecommerce business, one must understand important metrics and set goals to achieve growth. These important metrics can be analyzed through ecommerce reporting.
This will allow you to continually optimize your online store and ensure that it’s performing at its best.
In this article, we’ll discuss how ecommerce reporting can help you generate growth through measuring important metrics.
Let’s get started.

Key metrics to track with ecommerce reporting
Before we dive into how ecommerce reporting can help, it’s important to understand the key metrics you should be tracking.
Here are some of the most important metrics to consider:
Sales Metrics
Revenue: The total amount of money generated by your online store.
Average Order Value (AOV): The average amount spent by customers per order.
Conversion Rate: The percentage of visitors who make a purchase.
Traffic Metrics
Traffic Source: Where your website traffic is coming from (e.g. organic search, social media, paid advertising).
Bounce Rate: The percentage of visitors who leave your website after viewing only one page.
Pages Per Session: The average number of pages viewed per session.
Customer Metrics
Customer Lifetime Value (CLTV): The total amount of money a customer is expected to spend on your online store over their lifetime.
Customer Acquisition Cost (CAC): The cost of acquiring a new customer.
Repeat Purchase Rate: The percentage of customers who make a repeat purchase.
How ecommerce reporting can help optimize your online store
Understanding all data around your store can be valuable information. Thus, the more data the better.
Here’s what you can do with the data.
Identifying top-performing products
It can help you make informed decisions about which products to promote, discount, and remove from your inventory.

Understanding customer behaviour and preferences
Data points like traffic sources and pages per session can determine how customers are finding your website and what they’re interested in. Therefore allowing you to understand customers better.
Analyzing marketing campaign performance
Analyzing marketing data can help you make informed decisions about where to focus your marketing efforts and how to allocate your marketing budget.
Spotting areas for improvement in the purchasing process
It can determine where visitors are dropping off in the purchasing process and why.
Furthermore, it can help you make informed decisions about website design, the checkout process, and customer service.
Reducing cart abandonment rates
Analyzing data on the checkout process can identify potential issues that may be causing customers to abandon their carts.
To learn more about cart abandonment rates, read out article “Here’s how to reduce shopping cart abandonment“.
Tools for ecommerce reporting
There are many tools businesses can use for ecommerce reporting. Here are some options for ecommerce reporting tools:
Google Analytics
Google Analytics is a free tool that allows you to track website traffic and user behaviour.
It provides valuable insights into your website’s performance and can help you make informed decisions about website design, marketing, and more.
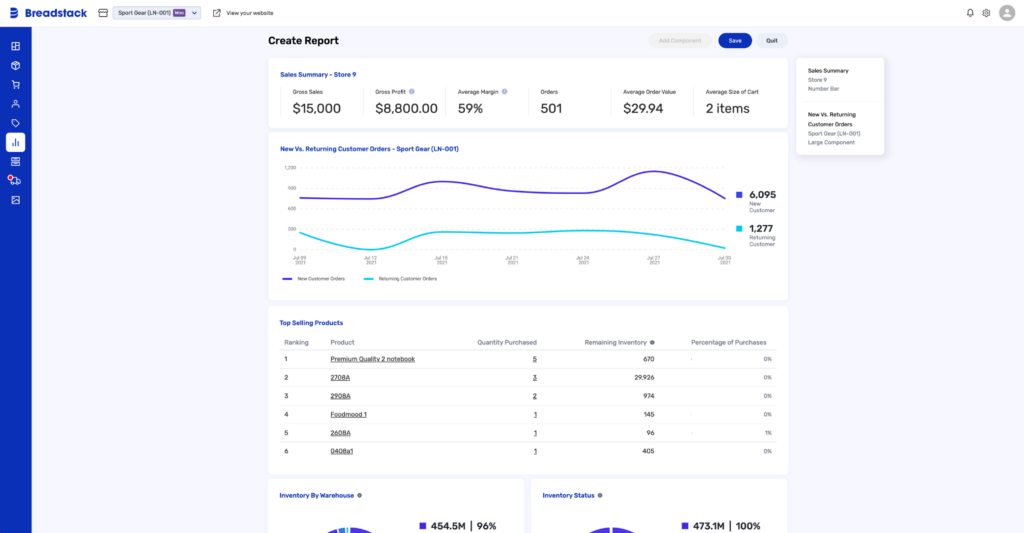
Breadstack
At Breadstack, we offer analytics and reporting to help you gain a better overview of what’s happening in your business for all departments.
Get the data you need with the most accurate and up-to-date reporting.
Read more about our analytics and reporting solution – click here.
Types of ecommerce reporting
There are many different types of ecommerce reporting, here are some of the more common ones.
Sales reports
Sales reports provide a comprehensive overview of revenue generation.
These reports include metrics like total sales, average order value, number of orders, and sales breakdown by product category.
Conversion reports
Conversion reports analyze the percentage of website visitors who take a desired action, like making a purchase.
Also, they offer insights into different stages of the customer journey, like add-to-cart and checkout completion rates.
Traffic reports
Traffic reports analyze website traffic sources and visitor behaviour, including metrics like visits, unique visitors, page views, and bounce rates.
Additionally, they help businesses identify effective marketing channels, measure campaign impact, and improve user engagement.
Customer reports
Customer reports analyze behaviour, preferences, and demographics, including metrics like acquisition, lifetime value, repeat purchase rate, and order frequency.
Hence, businesses can then understand their customer base, segment customers, personalize marketing, and tailor offerings to meet preferences.
Inventory reports
Inventory reports track the availability and movement of products within an ecommerce store.
By having accurate and up-to-date inventory information, businesses can certainily have efficient operations and meet customer demands effectively.

Financial reports
Financial reports offer a comprehensive view of an ecommerce business’s financial performance, including metrics like revenue, profit margin, and ROI.
Furthermore, by monitoring financial metrics closely, businesses can make informed decisions for growth and profitability.
Abandoned cart reports
Cart abandonment reports analyze customer behaviour when they add products to the cart but don’t complete the purchase.
Additionally, with these reports, businesses can improve the checkout experience, recover lost sales, and optimize conversion rates.
Best practices for ecommerce reporting
To get the most out of ecommerce reporting, it’s important to follow some best practices.
Here are some tips to consider:
Establish a baseline and set goals
Before you start tracking metrics, establish a baseline for your current performance and set goals for where you want to be.
Additionally, this will help you measure progress and stay on track.
Create custom reports to track specific metrics
Most ecommerce reporting tools allow you to create custom reports, which can help you track specific metrics and analyze data more effectively.
Analyze data on a regular basis
It’s important to analyze data on a regular basis (e.g. weekly, monthly) to stay up-to-date on your website’s performance and make informed decisions accordingly.
Make data-driven decisions
When it comes to optimizing your online store, it’s important to make data-driven decisions.
Altogether, use the data to inform your decisions and make changes accordingly.

Ecommerce reporting will help your store
Ecommerce reporting is a valuable tool for optimizing your online store.
Tracking key metrics and analyzing data, you can make informed decisions about website design, marketing, product offerings, and more.
Although, whether you’re using Breadstack or other ecommerce reporting tools, following best practices and making data-driven decisions will always serve you better.
Get started with ecommerce reporting for your store.
Interested in our ecommerce reporting?
