
Data is a key component of any business. To properly assess and understand data businesses will use reporting and analytics.
Understanding data will help make better decisions and enable businesses to keep improving. Although reporting and analytics may seem similar, they vary in a few differences.
In this article, we’ll help clarify these differences as well as offer clarity on how to use them in a business effectively.
Definition of reporting and analytics
Reporting is the definition of taking existing information and showing it in a way that is readable. Reports need to be accurate which is why they always have real data.
Reports are vital tasks for businesses as they can improve professional decisions. It can also tell you what is running smoothly or what needs more attention.
Analytics is the definition of adding or creating data to make a decision. Analytics use patterns of data that captivate information.
Analytics is usually used in business for predicting and improving performance.
An easy way to remember both definitions: Reporting is factual data that is made easier to read. Analytics is data that has formed through patterns to predict information.
What is the difference between reporting and analytics?
Reporting and analytics often get interchanged in the world of business, however, they do vary in differences.
Purpose
Reporting is to take data and make it easier to understand.
Analytics is about taking data and making predictions or providing insight.
Use
Reporting should be used around other jargon like organizing, consolidating or summarizing.
Methods of reporting could be:
- Product report
- Inventory reports
- Progress report
Analytics should be used around other jargon like investigating, questioning, examining or comparing.
Methods of analytics could be:
- Consumer behaviors
- Traffic sources
- Bounce rate
Value
Reporting provides real data points. It’s accurate and factual information that can be used for a better overview.
Analytics is about predictions. It can help make better-informed decisions about patterns or trends in the business.
Differences between reporting and analytics
Reporting:
- Help make better decisions about the business
- Create and view data through an organized format
- Gain an overview of the business
Analytics:
- Provide a better understanding of business operations
- View and understand data for valuable insights
- Predict different outcomes with multiple data points
Examples of reporting and analytics
Now, that we’ve looked at definitions and the differences between reporting and analytics, it’s time to see some examples
Examples of reporting
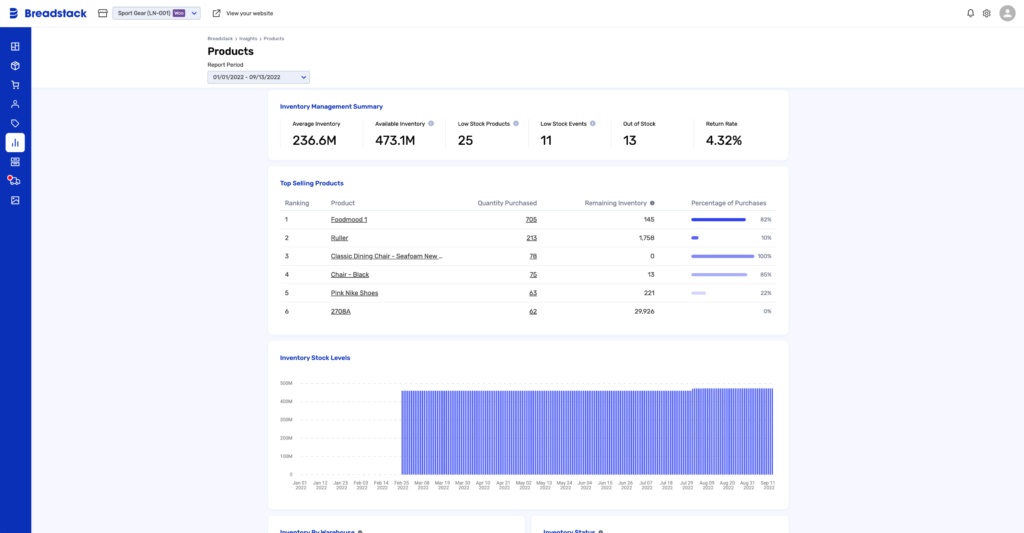
The photo below shows an inventory management summary report. We can see the top-selling products, inventory stock levels as well as some other additional details.
Comparing this report to our definitions and examples, we can see everything here is accurate, organized, and easily helps gain a better overview.
An example of how this report could be used is the information presented here can give the reader up-to-date information about stock levels allowing them to make better decisions around their inventory.
Examples of analytics
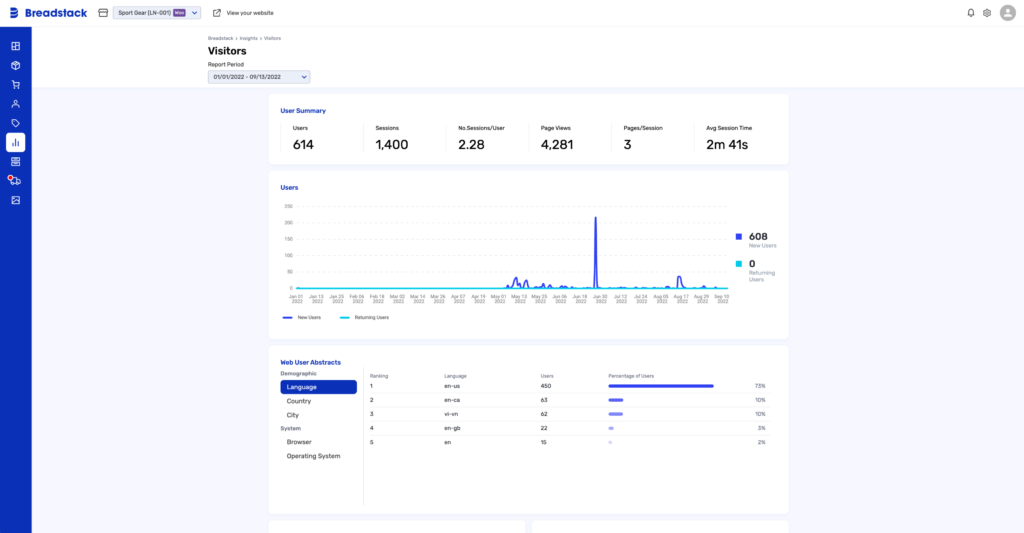
The photo below shows the analytics of visitors. We can see the average session time, demographic and other details.
Comparing this to all the information we have mentioned above about analytics it becomes clearer looking at the photo. It shows multiple data points that can help make predictions.
An example of how the analytics here can help make predictions is we can look at the average session time and make the assumption the page is not gathering enough engagement.
Using reporting and analytics
By using and understanding data, you gain a better overview of what’s happening in your business for all departments.
The more information the better. Understand all aspects of your business, such as customer service metrics, will be able to get you the reports you need. Always have information ready to be accessed.
Breadstack’s toolkit has reporting and analytics built in so you can get the data needed, whether that’s to create reports or predict outcomes with analytics.
Breadstack's features of reporting and analytics
- Make accurate real-time decisions
- Understand potential problems
- Minimize risks
- Inspires change with the right data
Ready to automate your reporting?
